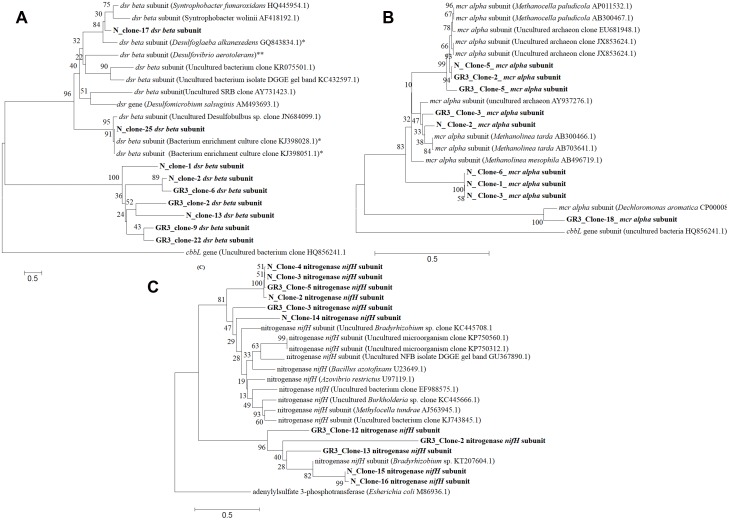
FIGURE 8.
Phylogenetic distribution of functional genes in GR3 and N. Neighbor-joining analysis was performed with 1000 bootstrap repeats to generate each tree using MEGA 6 software. Phylogenetic tree for (A) dsrB, (B) mcrA and (C) nifH gene segments from GR3 and N samples. Trees were constructed nucleotide sequence of each gene along with their closest BLASTN matches.

