Figure 1.
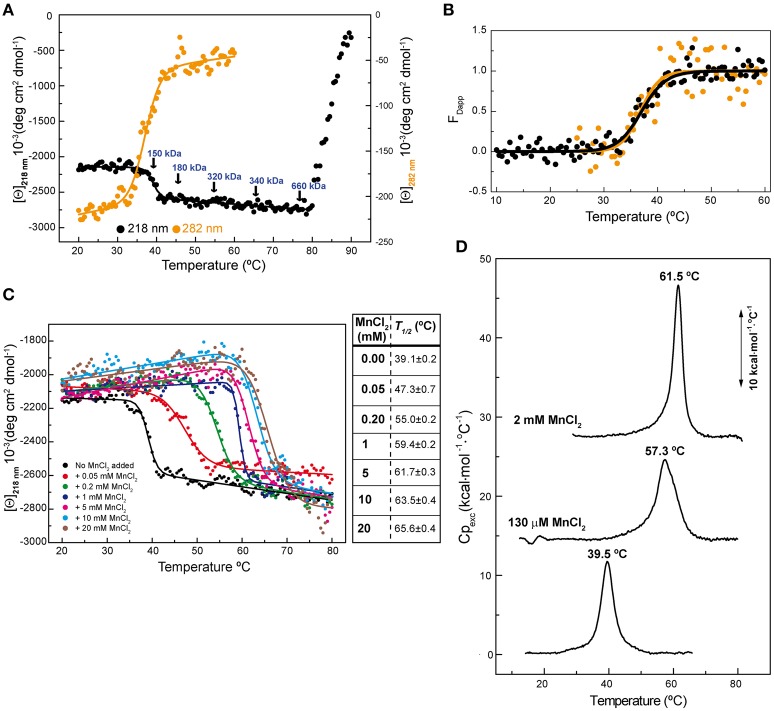
RepB6 low-temperature transition involves global changes in the protein structure. (A) Temperature-induced conformational changes of RepB6 as monitored by the variation of the ellipticity at 218 and 282 nm ([Θ] represents protein molar ellipticity). Samples heated at the indicated temperatures (arrows) were analyzed by analytical ultracentrifugation (sedimentation equilibrium), and the estimated average molecular masses are displayed on the protein CD thermal profile. (B) Apparent fraction of modified protein (FDapp) calculated from the transition curves registered at 218 nm (•) and 282 nm ( ) between 10 and 60°C. The solid line shows the fit of Equation (1) to FDapp values. (C) Temperature transition curves of RepB6 (12 μM) in the presence of increasing concentrations of MnCl2 (indicated inside the graph) measured by CD at 218 nm. The table shows the apparent half-transition temperatures of RepB6 derived from fit of Equation (1) to the figure experimental curves (solid lines). (D) DSC profile of the first thermal transition of RepB6 (30 μM) monitored in the absence and in the presence of 130 μM or 2 mM Mn2+. The position of the maximum of the heat capacity function (Tm) is indicated.

