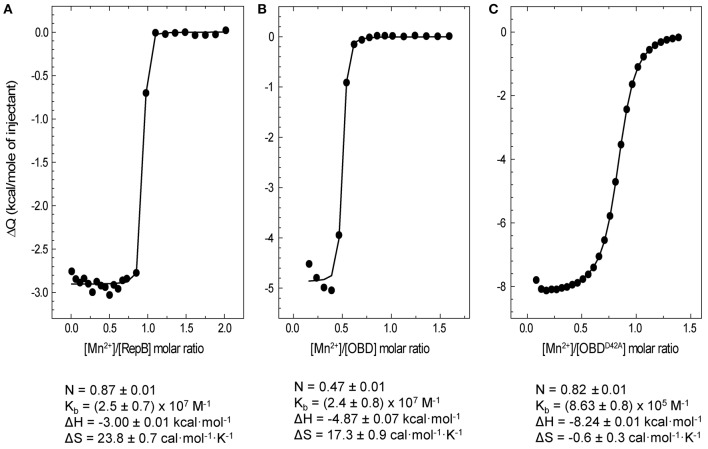
Figure 6.
ITC analysis of Mn2+ binding to RepB6, OBD, and OBDD42A. Symbols represent the heat released by mole of Mn2+ injected as a function the Mn2+/protein molar ratio measured at 25°C in ITC buffer. Titrations were performed by adding 1 mM MnCl2 to RepB6(A), OBD (B), or OBDD42A (C) proteins at concentrations ranging from 95 to 119 μM. The binding parameters derived from the fit of the single site binding model to the experimental curve are shown at the bottom and the corresponding theoretical curves are depicted as solid lines.

