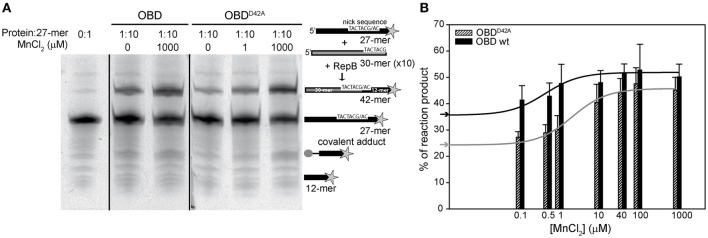
Figure 7.
Nicking and strand-transfer activity of OBD and OBDD42A on ssDNA oligos in the presence of different metal concentrations. (A) Reaction product pattern generated by the nicking and strand-transfer activities of OBD and OBDD42A on ssDNA oligos at the indicated protein:oligo substrate molar ratio and different concentrations of MnCl2. The 27-mer oligo substrate (500 nM), labeled in 3′ with the fluorescent dye Cy5 (indicated by a star), and a 10-fold molar excess of the unlabeled 30-mer oligo were incubated with the protein at 37°C for 1 min. The resultant fluorescent oligos were analyzed by electrophoresis in 20% PAA, 8 M urea denaturing gels and visualized with the aid of FLA-3000 (FUJIFILM) imaging system. A schematic description of the different reaction products is depicted on the right side of the gel image. To compare the reactions products generated by the activity of OBD and OBDD42A the images from different gels acquired and processed under the same conditions have been grouped and indicated by dividing lines. (B) Vertical bar graph comparing the percentage of reaction products rendered by OBD and OBDD42A due to the addition of the indicated concentrations of MnCl2. The assays were performed as depicted in panel A with a protein:oligo substrate molar ratio of 1:10. Vertical bars represent the average value of three different experiments. Errors bars represent standard deviations. The activity increases of OBD and OBDD42A were fitted by nonlinear regression (solid line) to a ligand binding model assuming a single class of binding site for Mn2+. The best fitting values for the apparent dissociation constant for OBD and OBDD42A were 0.5 ± 0.3 and 2.6 ± 0.6 μM, respectively. The percentage of reaction products measured in the absence of MnCl2 added for OBD ( ) and OBDD42A (
 ) is indicated on the y-axis.

