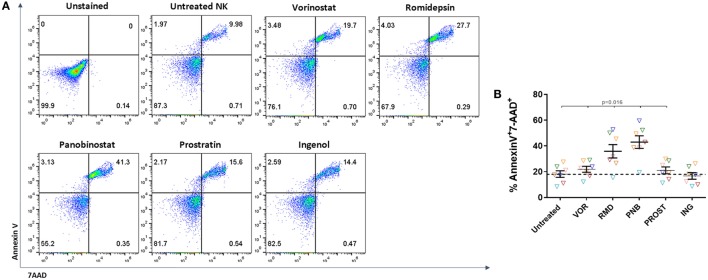
Figure 2.
Toxicity of LRAs on NK cells. Proportion of dead NK cells after 24-h exposure to the different LRAs. (A) Representative FACS analysis showing the gating strategy to identify dead cells according to Annexin V and 7-AAD staining. Cell death was considered when cell were double positive for Annexin V and 7-AAD. (B) Proportion of dead NK cells after exposure to the different LRAs, expressed as fold change relative to the untreated condition. Each color represents cells from a different donor. There was a general trend toward a decrease in viability after exposure with all drugs except for ING, but RMD and PNB impact was more pronounced and significantly higher than VOR, PROST, or ING (p < 0.02). N = 7.

