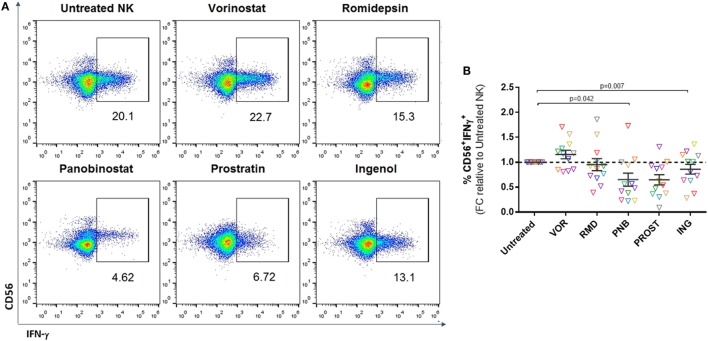
Figure 4.
Cytokine production. Proportion of CD56+IFN-γ+ cells after 4–6 h culture with K562 cells. (A) Representative FACS analysis showing gating strategy after intracellular staining with IFN-γ. (B) Proportion of CD56+ cells positive for IFN-γ expressed as fold change relative to the untreated NK condition. Each color represents cells from a different donor. VOR, RMD, or ING do not have a significant effect on IFN-γ production, while PNB and PROST impaired cytokine production. N = 12.

