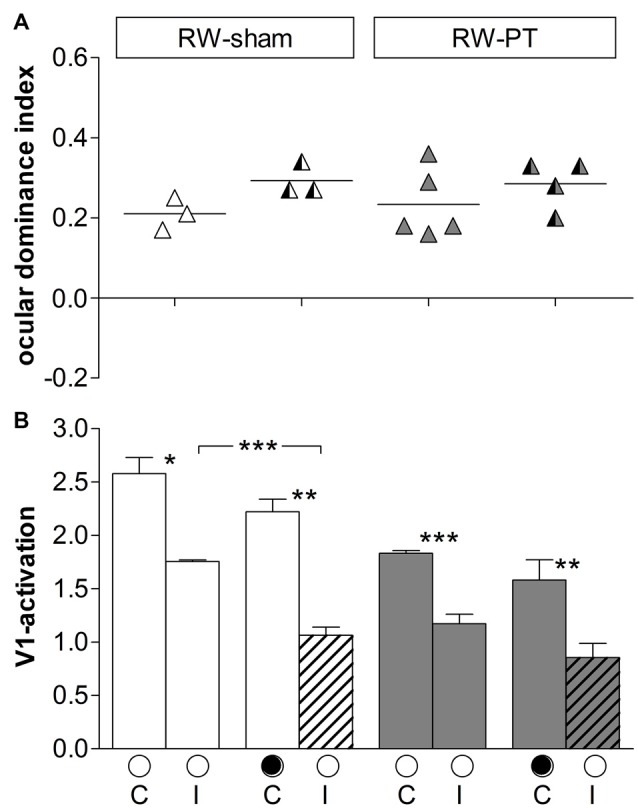
Figure 4.

ODIs and V1-activation in V1 of the non-lesioned right hemisphere in RW-mice after PT or sham treatment. (A) Optically imaged ODIs without and with MD of sham treated (RW-sham, white) and PT-mice (RW-PT, gray) raised in RW-cages. Symbols represent ODI-values of individuals; means are marked by horizontal lines. (B) V1-activation elicited by stimulation of the contralateral (C) or ipsilateral (I) eye without and after MD. Data are displayed as in Figure 3. *p < 0.05, **p < 0.01, ***p < 0.001.
