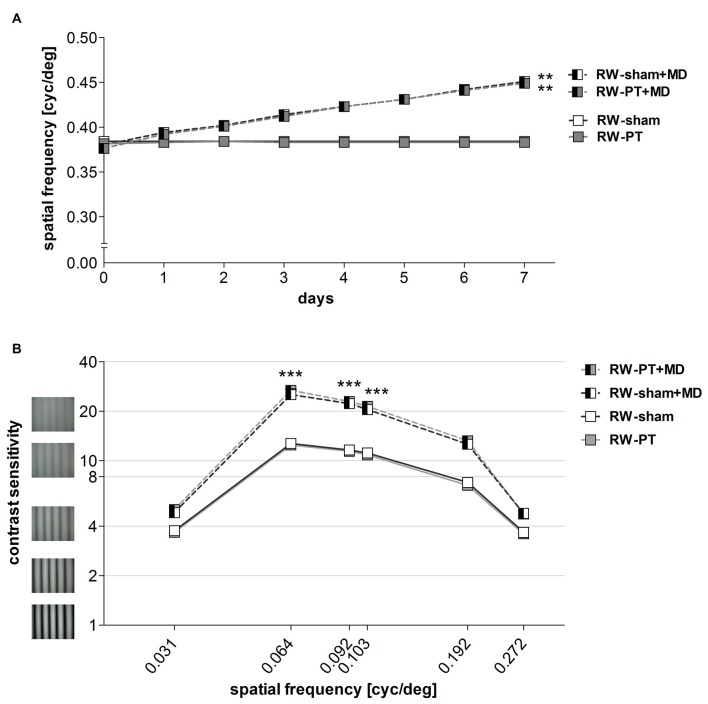
Figure 5.
Enhanced optomotor reflex after MD in RW-mice. (A)The spatial frequency threshold of the optomotor reflex in cyc/deg plotted as a function of days. (B) Contrast sensitivity thresholds of optomotor reflex measured on 7th day of MD/noMD in six different spatial frequencies. All the groups without MD are illustrated as boxes and with MD as half-filled boxes. PT-groups are presented in gray color and sham groups in white. Note that there was a significant improvement of thresholds after 7 days of MD regardless of the induction of a lesion. There was no significant difference between sham- and PT-mice after MD, nor between sham- and PT-mice without MD. **p < 0.01, ***p < 0.001.

