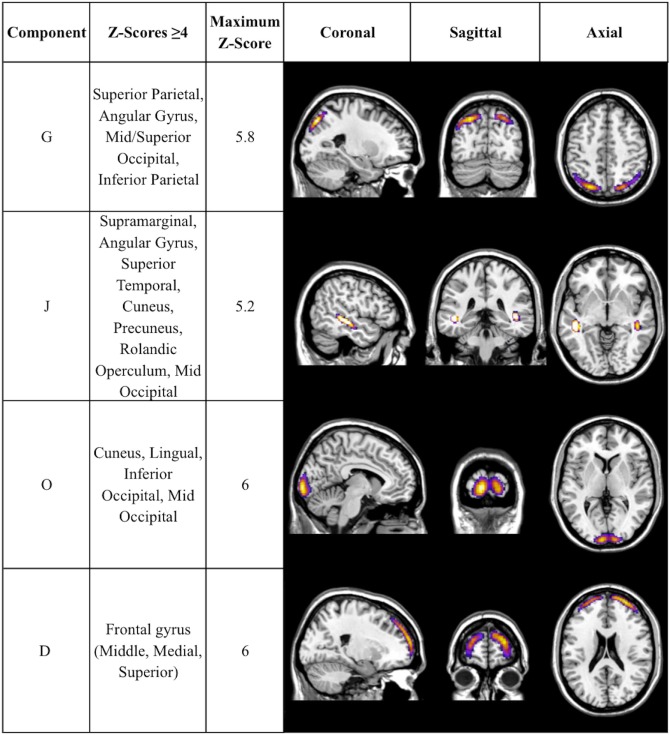
Figure 2.
Additional components with CAP-group significance of p ≤ 0.004. Coronal, sagittal, and axial views of Table 3 components, thresholded to optimally view regions with maximum Z-scores. Regions displayed in each component have Z-scores between 4.0 and the component’s maximum Z-score, displayed in column 3.

