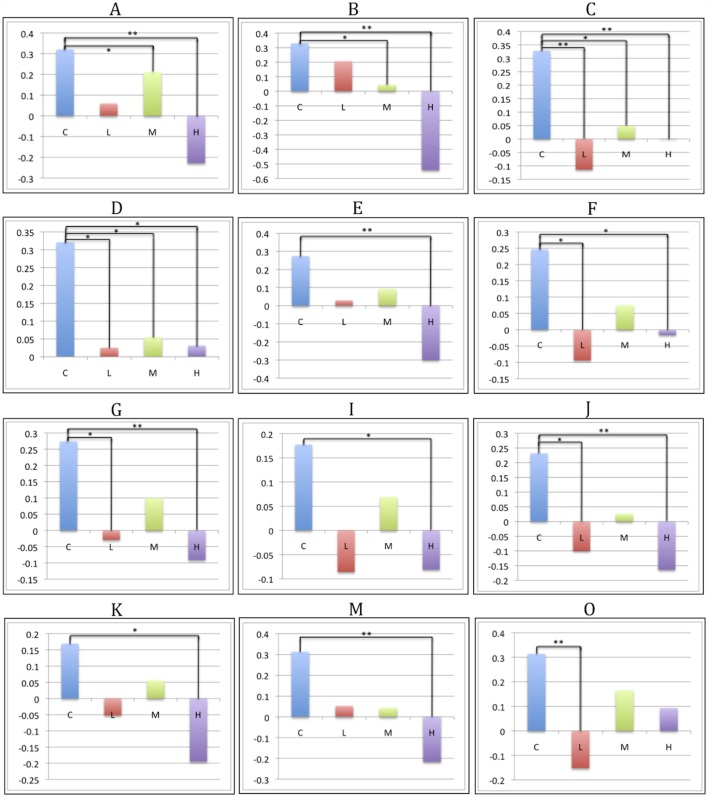
Figure 3.
CAP-group differences in SBM loading coefficients. Significant pairwise group contrasts in CAP-group-significant components, derived from the Sidak post hoc test. Comparisons labeled with a single asterisk (*) denote significance of p ≤ 0.05; comparisons labeled with two asterisks (**) denote significance of p ≤ 0.0001.

