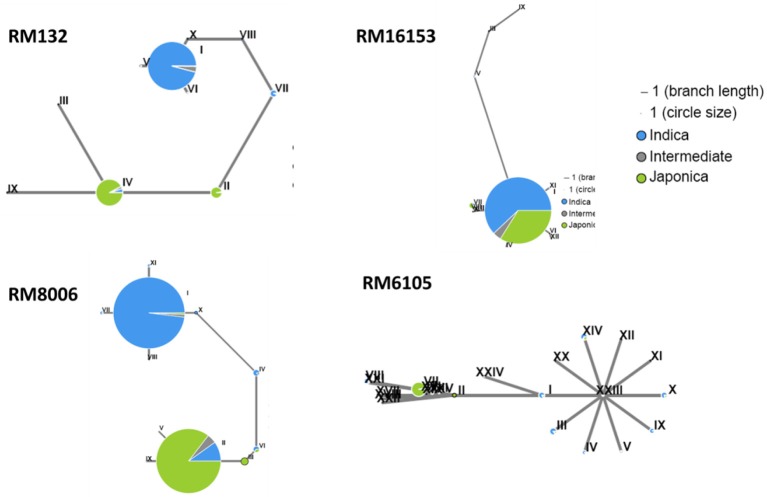
Figure 4.
Haplotype analysis of the genomic regions (~100 kb) flanking four associated markers. The drafts were generated with 44 SNPs flanking each marker by using the analysis tool provide by RiceVarMap (http://ricevarmap.ncpgr.cn/hap_net/); green and blue represent the japonica and indica subspecies, respectively, and gray represents the intermediate.

