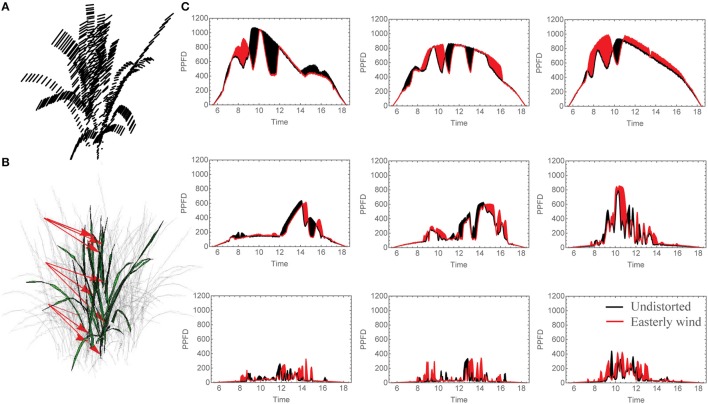
Figure 2.
Changing Light Patterns due to simulated Easterly wind. (A) Schematic of plant distortion indicating center of each triangle before and after simulated mechanical canopy excitation, (B) leaf locations analyzed for light patterns given in (C), the selected light patterns over the whole day where black shaded regions indicate a period of higher light intensity in the undistorted orientation (no wind) and red indicates a period of higher light intensity for the distortion corresponding to an easterly wind. N.B. The three grid strata in (C). Correspond to the canopy strata as indicated by the arrows in (B).

