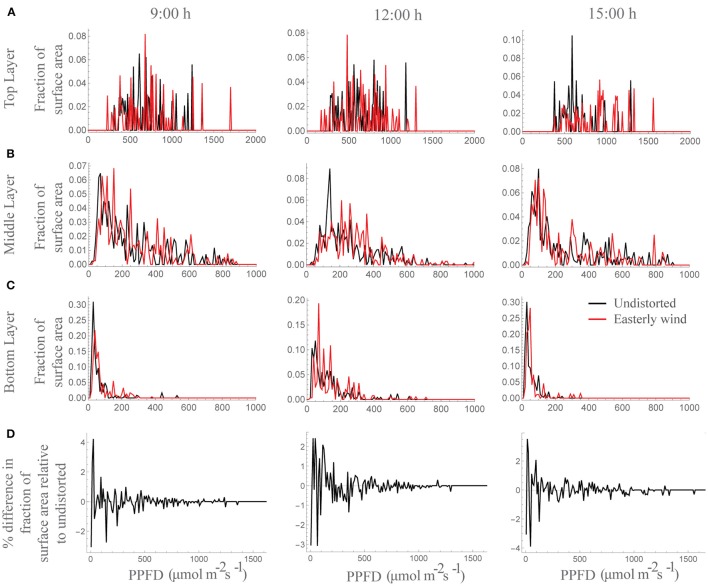
Figure 3.
Frequency of PPFD values according to the fraction of surface area received at by a whole plant within a canopy at 9:00, 12:00, and 15:00 h. (A) Top layer, (B) middle layer, and (C) bottom layer where black is the undistorted canopy and red is the distortion equivalent to an easterly wind. (D) Percentage difference in the fraction of the total surface area receiving each PPFD value relative to the undistorted state; i.e., positive values indicate a higher surface area of the easterly wind distorted canopy receiving that set level of PPFD and negative values indicate a higher surface area of the undistorted canopy.

