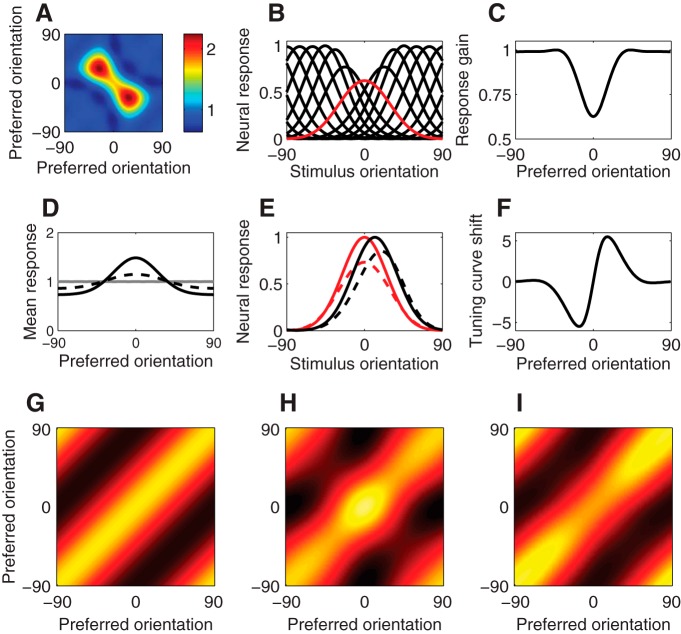
Figure 3.
Adaptation in the response-product homeostasis model. A, Normalization weights following adaptation to a vertical (0°) adapter, arranged according to the preferred orientations of each pair of neurons. Preadaptation weights were initially uniform and constant. The two peaks along the diagonal represent increased normalization weights between pairs of neurons with preferred orientations on opposite sides of the adapter orientation. B, Neural tuning curves following adaptation. Red curve represents tuning curve of neuron tuned to the vertical adapter. C, Postadaptation neural response gain (peak value of the tuning curve) as a function of preadaptation preferred orientation. D, Mean responses. Gray curve represents mean responses (averaged across the unbiased stimulus distribution) for unadapted neurons, as a function of preferred orientation. Solid black curve represents mean responses for the biased stimulus distribution without adaptation. Dashed black curve represents postadaptation mean responses for the biased stimulus distribution. Adaptation partially restores imbalances in mean neural responses with the biased stimulus distribution. E, Tuning curves for two example simulated neurons. Solid curves represent preadaptation. Dashed curves represent postadaptation. Red curves represent neuron tuned to the adapter orientation. Black curves represent neuron tuned to a flanking orientation. F, Postadaptation shift of preferred orientation (measured using the circular mean of the tuning curve) as a function of preadaptation preferred orientation. G–I, Neural response covariance. G, Neural response covariance for the unbiased stimulus distribution, without adaptation. H, Neural response covariance for the biased stimulus distribution, without adaptation. I, Neural response covariance for the biased stimulus distribution postadaptation.

