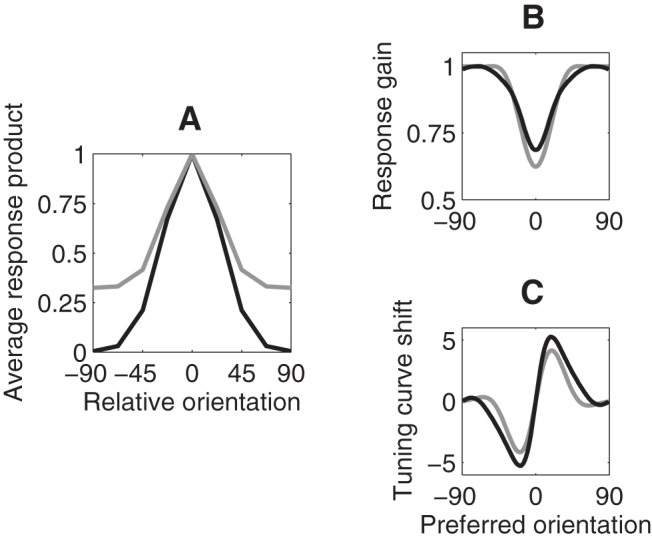
Figure 6.

Homeostatic targets. A, Two different possible homeostatic targets, corresponding to two different environments, plotted as a function of relative orientation. Solid black curve represents response products corresponding to an unbiased ensemble of gratings. Gray curve represents response products corresponding to natural textures. B, Postadaptation neural response gain (peak value of the tuning curve) as a function of preadaptation preferred orientation. C, Postadaptation shift of preferred orientation (measured using the circular mean of the tuning curve) as a function of preadaptation preferred orientation. B, C, Black and gray curves represent results using homeostatic targets shown in the corresponding colors in A.
