Figure 4.
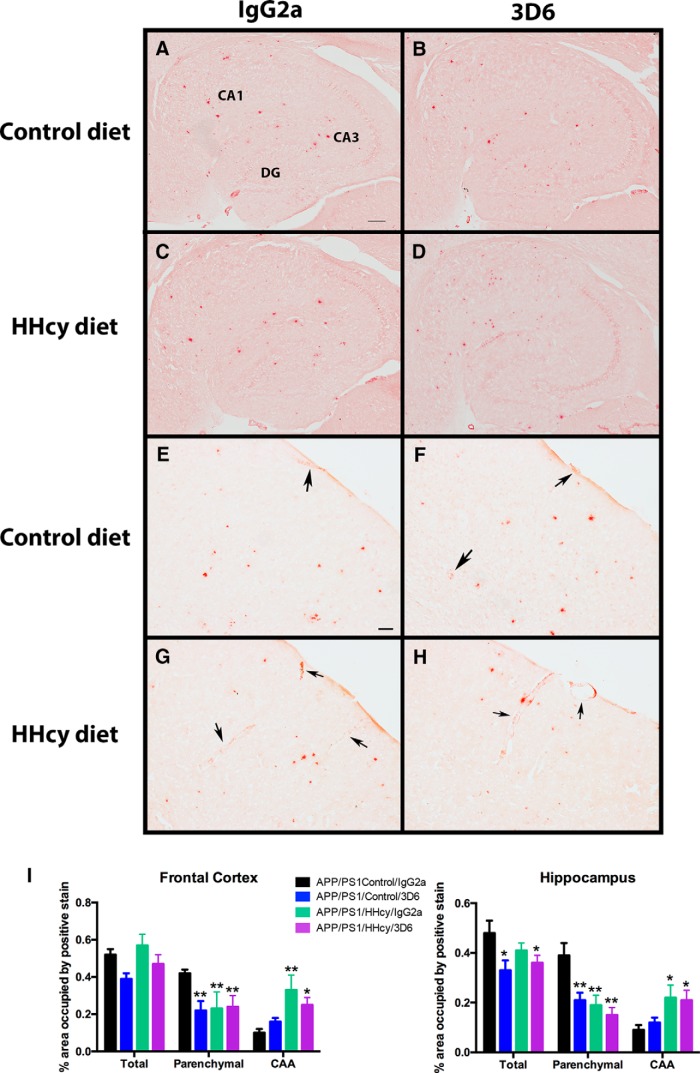
HHcy redistributes amyloid to the vasculature. Representative images of Congo red staining in the hippocampus of APP/PS1, control, and IgG2a (A), APP/PS1, control, and 3D6 (B), APP/PS1, HHcy, and IgG2a (C), and APP/PS1, HHcy, and 3D6 (D). A, The CA1, CA3, and DG are labeled for orientation. Scale bar: A, 200 μm. Representative images of Congo red staining in the cortex of APP/PS1, control, and IgG2a (E), APP/PS1, control, and 3D6 (F), APP/PS1, HHcy, and IgG2a (G), and APP/PS1, HHcy, and 3D6 (H). Scale bar: E, 50 μm. Black arrows indicate Congo staining around a vessel (CAA). I, Quantification of percentage positive stain in the frontal cortex and hippocampus. *p < 0.05, compared with APP/PS1, control, and IgG2a. **p < 0.01, compared with APP/PS1, control, and IgG2a.

