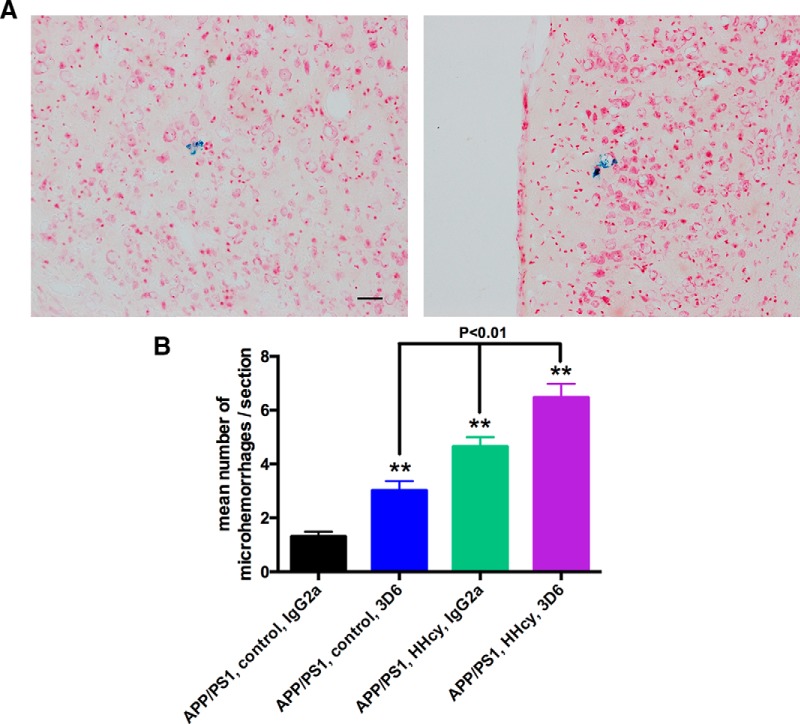
Figure 6.
The 3D6 and HHcy increase Prussain blue detected microhemorrhages. A, Representative images of Prussian blue-positive microhemorrhages in the frontal cortex. Scale bar, 120 μm. B, Quantification of the mean number of microhemorrhages per section. **p < 0.01, compared with APP/PS1, control, and IgG2a. Black bars represent significant differences between connecting groups.

