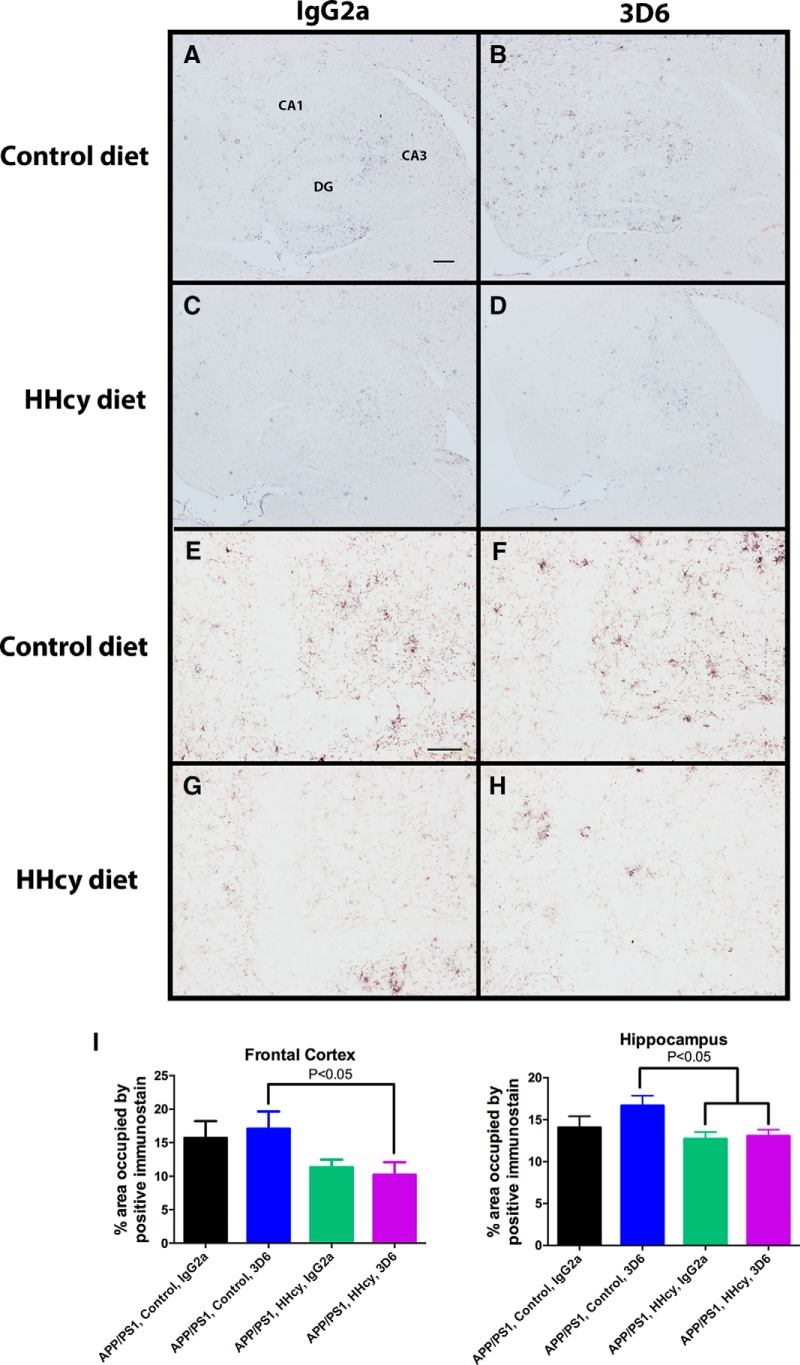
Figure 7.
CD11b staining is decreased in the HHcy groups. Representative images of CD11b staining in the hippocampus of APP/PS1, control, and IgG2a (A), APP/PS1, control, and 3D6 (B), APP/PS1, HHcy, and IgG2a (C), and APP/PS1, HHcy, and 3D6 (D). A, The CA1, CA3, and DG are labeled for orientation. Scale bar: A, 120 μm. Higher-magnification images of CD11b staining in the dentate gyrus of APP/PS1, control, and IgG2a (E), APP/PS1, control, and 3D6 (F), APP/PS1, HHcy, and IgG2a (G), and APP/PS1, HHcy, and 3D6 (H). Scale bar: E, 50 μm. I, Quantification of percentage positive stain in the frontal cortex and hippocampus.

