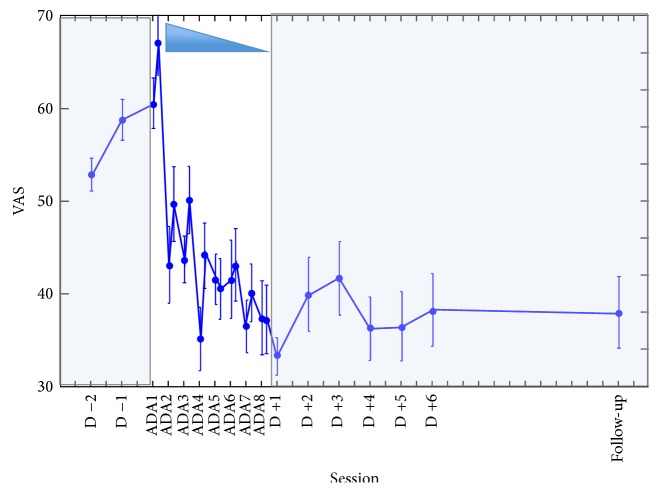
Figure 6.
Evolution of mean pain (±SEM) for the 7 patients from 2 days before prism adaptation to follow-up consultation. In white background is the prism rehabilitation period. The shaded background indicates the pre- and postperiods of follow-up. Before the intervention, the apparent increase of average pain level was not confirmed by individual analyses. During the intervention period, a substantial decrease of pain is observed. Following the intervention and up to the follow-up consultation (D +15), remarkable stability of pain measures was observed.

