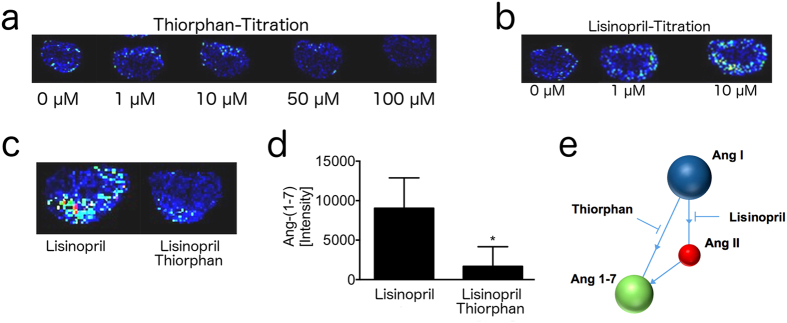
Figure 3. MALDI-Imaging reveals DL-thiorphan-sensitive Ang-(1-7) formation in renal cortex of mice.
(a) Diminishing effect of increasing DL-thiophan concentrations (0 μM – 100 μM) on local turnover of Ang I to Ang-(1-7) is shown by MALDI-Imaging. Brighter colors of the murine kidney section indicate pronounced Ang-(1-7) formation in the renal cortex. (b) Increasing Ang-(1-7) signals depending on lisinopril concentration (0 μM–10 μM). (c) Inhibitory capacity of 100 μM DL-thiorphan on Ang I to Ang-(1-7) turnover in presence of 10 μM lisinopril (d) Intensity of Ang-(1-7) formation (Fig. 3c) was calculated and is given in bars. n = 4 per group. Data presented as mean ± s.d. Two-tailed Student’s t-test. *P < 0.05 vs. 10 μM lisinopril. (e) Schematic graph highlights the targeted angiotensin pathways of the used inhibitors.

