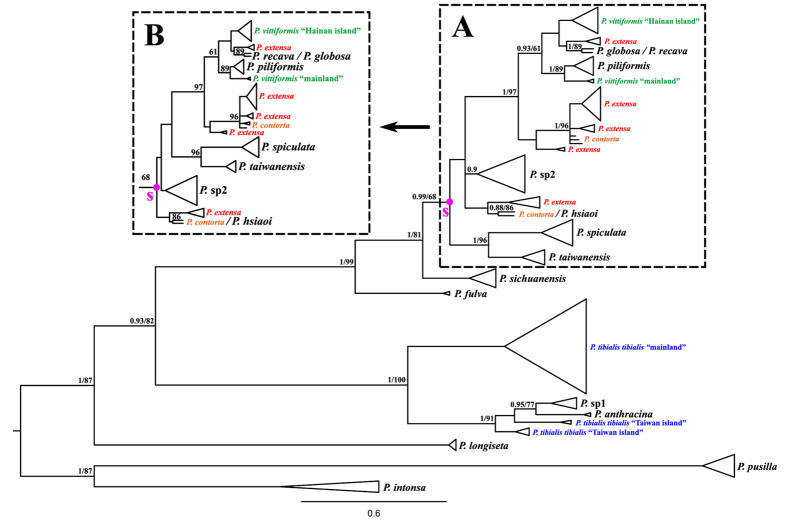
Figure 2. Phylogram of the gene tree based on mitochondrial DNA.
The color species name representing non-monophyly of the four species in the gene tree. Purple circles mark nodes S group representing “Node S Species Composition” (NSSC). The phylogenic relationship within the NSSC species showed different topological structure in the two analytical methods: (A) Bayesian inference (BI); (B) Maximum likelihood (ML). Posterior probabilities/ML bootstrap percentages under 0.8/50 are not showed.

