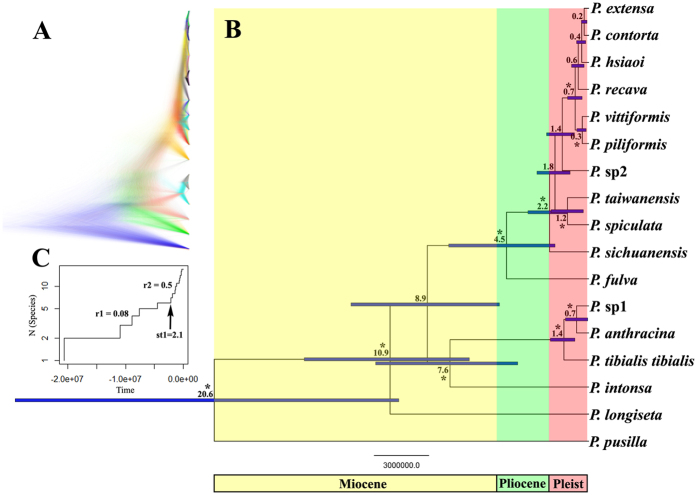
Figure 3.
(A) Cloudogram of the multilocus species tree analyses performed using the algorithm implemented in *BEAST. (B) Chronogram of the same species tree showing estimates of divergence times obtained with BEAST. Blue bars are 95% confidence intervals. Numbers at nodes are the average estimates of divergence times in myr ago. Asterisks indicate nodes with posterior probability >90%. (C) Lineage Through Time (LTT) plot for Pseudovelia species radiation. Relative time is given on the x-axis, number of species is given on the y-axis.

