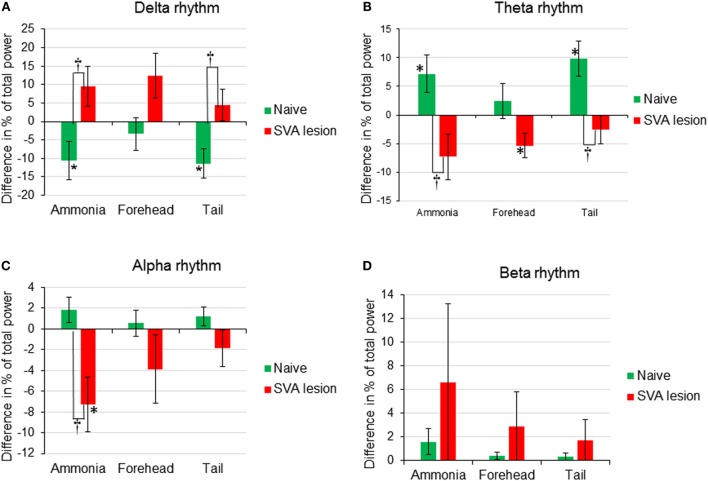
Figure 2.
Comparison of changes (difference between percent of total power before and after stimulus) of EEG rhythms [(A) Delta rhythm, (B) Theta rhythm, (C) Alpha rhythm, (D) Beta rhythm] expressed as change in percent of total power in response to nasal ammonia vapor instillation and forehead and tail cold stimulation in naïve (n = 12, green bars) and animals after the lesioning of the subthalamic vasodilator area (n = 7, red bars), *p < 0.05 significance of the amplitude of the response compared with the baseline, †p < 0.05, significance between response in naive and SVA-lesioned animals, error bars – SEM.

