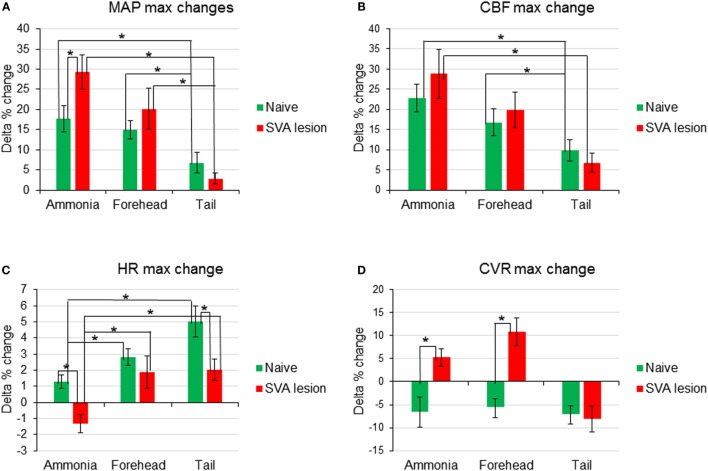
Figure 4.
Comparison of changes of the maximum amplitudes of early responses of mean arterial pressure [MAP (A)], cerebral blood flow [CBF (B)], heart rate [HR (C)], and cerebrovascular resistance [CVR (D)] in response to nasal ammonia vapor instillation and forehead and tail cold stimulation in naïve animals (n = 12, green bars) and animals after the lesioning of the subthalamic vasodilator area (n = 7, red bars), *p < 0.05, error bars – SEM.

