Figure 2.

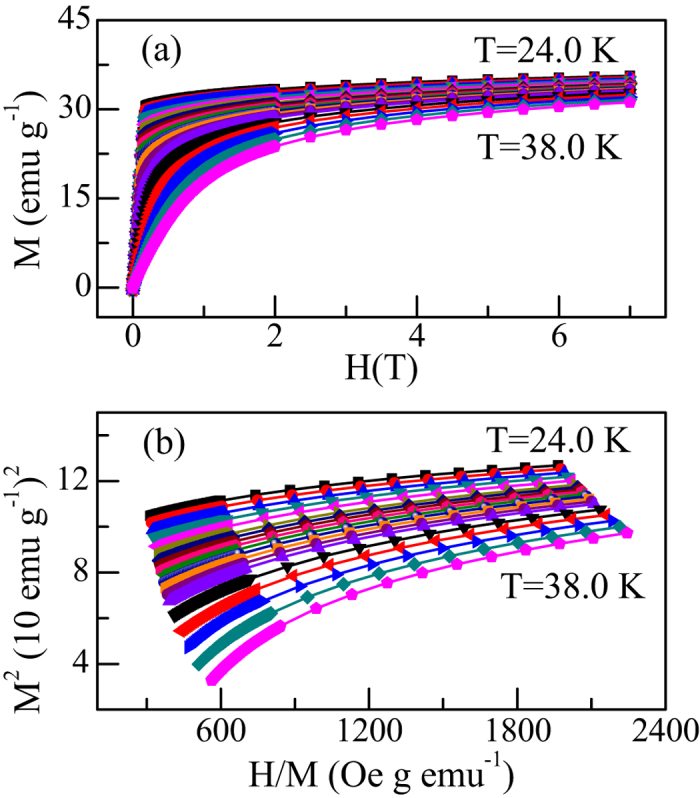
(a)Typical initial isotherm curves around TC for CrSiTe3; (b) the Arrott plot (M2 vs. H/M) of isotherms around TC for CrSiTe3.

(a)Typical initial isotherm curves around TC for CrSiTe3; (b) the Arrott plot (M2 vs. H/M) of isotherms around TC for CrSiTe3.