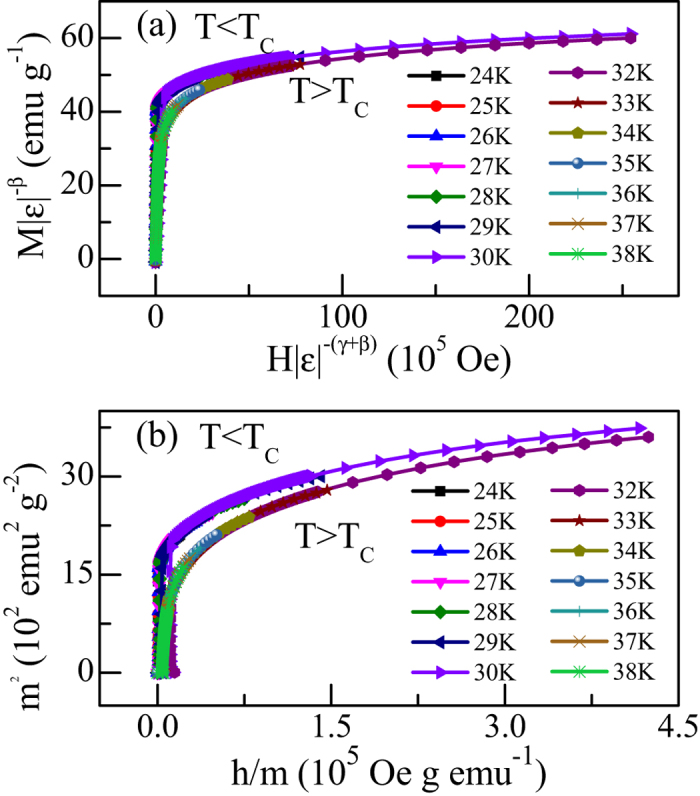
Figure 6.

(a) The renormalized magnetization plotted as a function of renormalized field following Eq. (5) with TC = 31.0 (K), and β, γ from Table 1 for CrSiTe3. (b) The renormalized magnetization and field (defined in text) replotted in the form of m2 vs. h/m for CrSiTe3. The above two plots show all data collapse into two separate branches: one below TC and another above TC.
