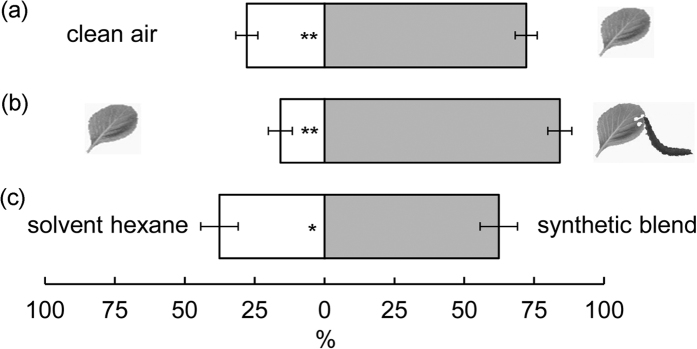
Figure 2.
Orientation (percentage ± se) of P. xylostella larvae to VOCs from (a) healthy cabbage plants vs clean air, (b) larva-infested vs healthy cabbage plants, and (c) a synthetic bouquet resembling the larva-induced blend vs a hexane control in Y-tube olfactometers. The number of responding larvae/the total number of larvae tested is 110/128 (a), 123/134 (b), and 65/132 (c). Asterisks indicate a preference which is significantly different from an equal distribution within a choice test: *P ≤ 0.05; **P ≤ 0.001.

