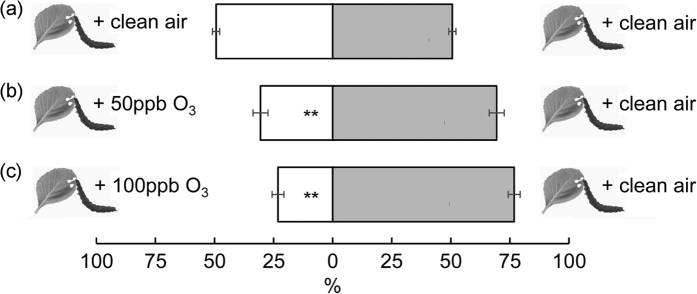
Figure 4. Attraction (percentage ± se) of P. xylostella larvae to P. xylostella-induced cabbage VOC blends mixed with O3 (50 or 100 ppb) or clean air in Y-tube olfactometers.
The number of responding larvae/the total number of tested larvae in (a–c) is 85/98, 109/133 and 104/117, respectively. Asterisks indicate a preference which is significantly different from an equal distribution within a choice test: **P ≤ 0.001.

