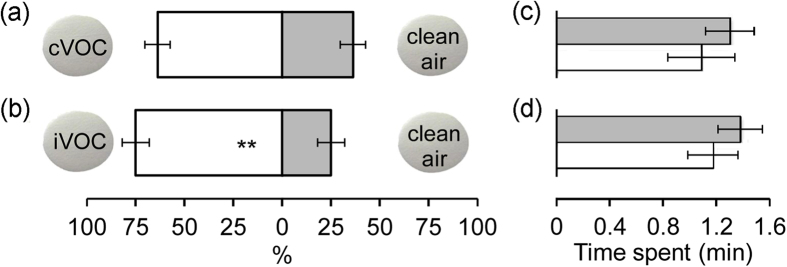
Figure 6. Orientation of P. xylostella larvae in Petri dishes towards Teflon filters that had been exposed to cabbage VOCs (while bars; iVOC: P. xylostella-induced VOC; cVOC: constitutive VOC) or clean air (grey bars).
(a,b) Percentage (mean ± se) of larvae choosing filters. The number of responding larvae/the total number of tested larvae in (a,b) is 64/160 and 65/112, respectively. Asterisks indicate a significant preference based on two-sided binomial tests: **P ≤ 0.001. (c,d) Mean time spent on filters (±se). Data in (c; grey|white = 12|16) and (d; grey|white = 17|47) were derived from a subset of observations in (a,b), respectively.

