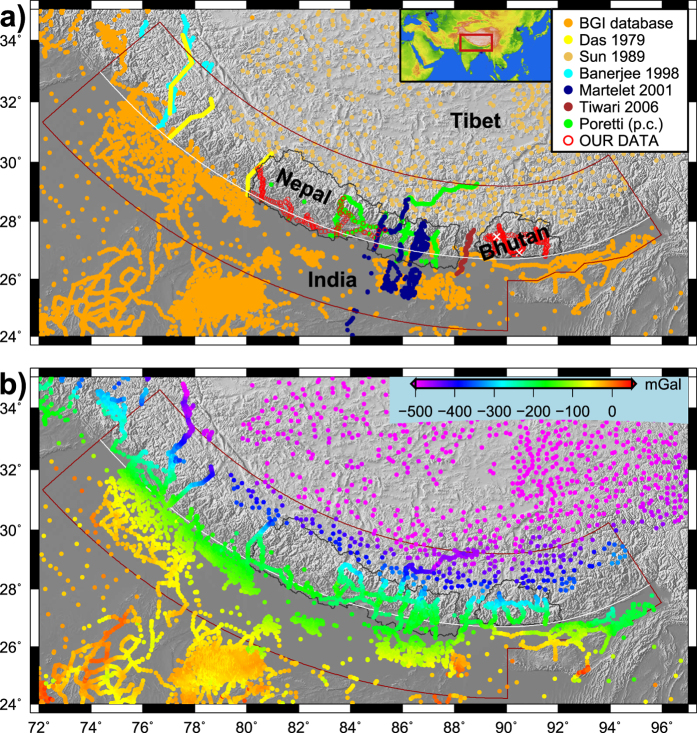
Figure 1. Gravity data.
(a) Sources of our gravity data compilation (11470 points on map), including new absolute gravity points in Bhutan (white crosses). See main text for description and references. Inset: location of maps in this study. (b) Bouguer anomaly map of the Himalayas and surrounding region, referenced to sea-level and using 2670 kg/m3 reduction density. Brown contour is the limit of our study area. White arc approximates the topographic front (mostly the Main Frontal Thrust). Boundaries of Nepal and Bhutan are shown in black as reference. Map created with GMT software39 version 4 (http://gmt.soest.hawaii.edu/).

