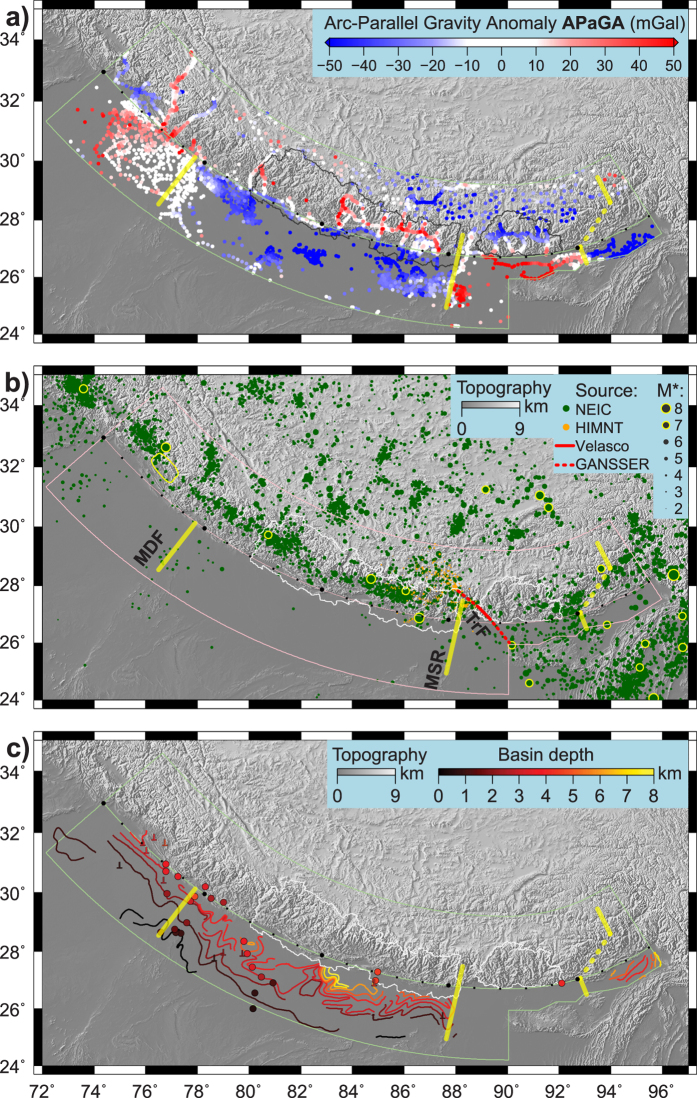
Figure 4. Spatial comparison of APaGA, seismicity and foreland basin depth.
Study area and central arc as in Fig. 1, black dots on arc approximating the topographic front are placed every 100 km (every 5th larger) as a reference for Fig. 3. (a) Arc-Parallel Gravity Anomaly (from Fig. 2c). Red and blue values represent respectively higher and lower values of gravity compared to the average profile perpendicular to the Himalayan arc. Yellow lines highlight along-arc changes in APaGA, which are then reported on the two subsequent figures. (b) Distribution of seismicity. Colour code refers to the source of the data: NEIC is the ANSS Comprehensive Catalogue maintained by the USGS (http://earthquake.usgs.gov/earthquakes/search/), HIMNT project data ref. 41. TrF is the transfer (or transform) fault zone as suggested by seismicity based on ref. 35 and GANSSER project data36. Star indicates that magnitude scales are not homogeneous across the three catalogues. Earthquakes with magnitude larger than 7 are highlighted with yellow contour. The 1905 Kangra earthquake rupture contour40 is shown in yellow. MDF: Mahendragar-Dehradun Fault. MSR: Munger-Saharsa Ridge. (c) Foreland basin depth. Isopach contours are from ref. 32. Inverted T symbols denote borehole data42,43,44,45. Circles are estimates from receiver functions46,47,48,49. Map created with GMT software39 version 4 (http://gmt.soest.hawaii.edu/).

