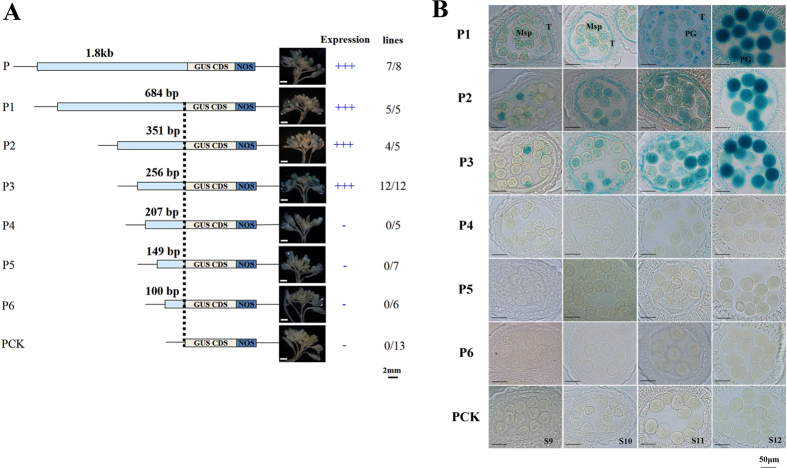
Figure 3. BnSP11-1 promoter deletion analysis.
(A) Promoter deletion constructs (P1-GUS to P6-GUS), the control construct PCK and summary of GUS staining results. Numbers indicate positions relative to the BnSP11-1 translation start site. Photographs were taken after 16 h GUS incubation. Relative expression of each promoter construct in stamen is represented by +(positive) or −(negative). ‘Lines’ column indicates the number of individual transformants displaying stamen GUS activity over total number of transformants analyzed; Bars = 2 mm. (B) Representative GUS staining results for semi-thin section from stage 9 to stage 12 of lines transgenic for the indicated BnSP11-1 promoter deletion constructs and the control construct PCK. T, tapetum; Ms, microsporocyte; Tds, tetrads; Msp, microspore; PG, pollen grain; Bars = 50 μm.

