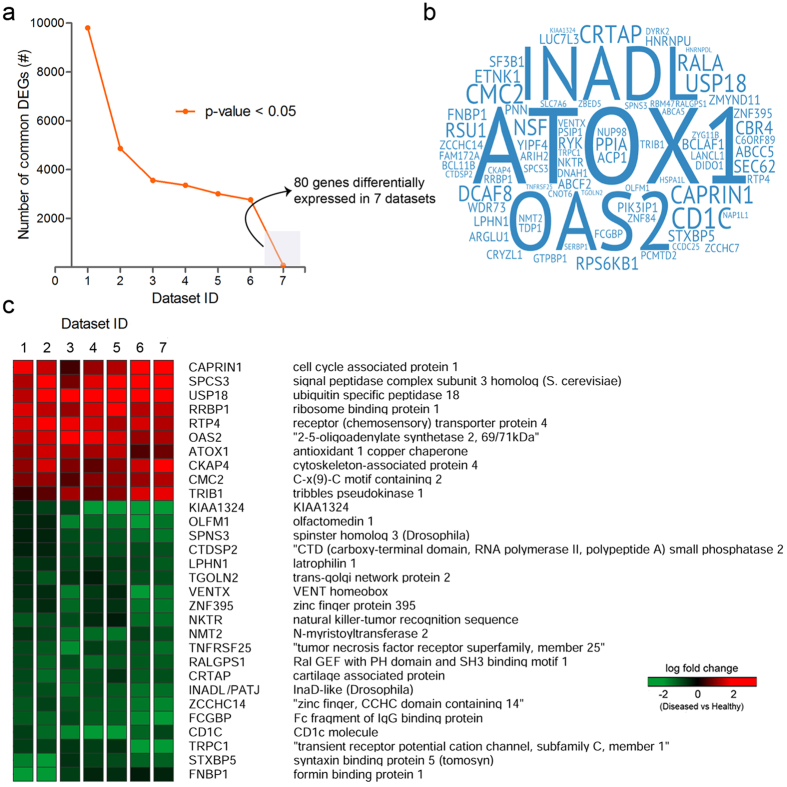
Figure 2. Transcriptome meta-analysis of Dengue virus infected patients.
(a) A graph representing data sets sharing the number of common DEGs. (b) Cloud representation of common DEGs expressed across 7 data sets. (c) Heat map showing consistently expressed genes (meta-genes) in different data sets used in this study.

