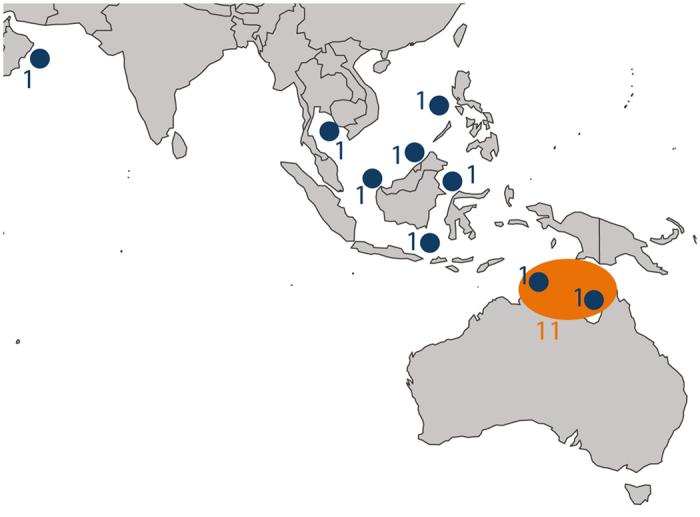
Figure 1. Sampling locations with sample size.

Samples in blue were included in the scatter dataset (SCD, 9 samples). Samples in orange were considered for the single deme dataset (SID, 11 samples). Map of sampling locations was generated with the library “rworldmap” with R software (v3.0.2, https://cran.r-project.org/)54.
