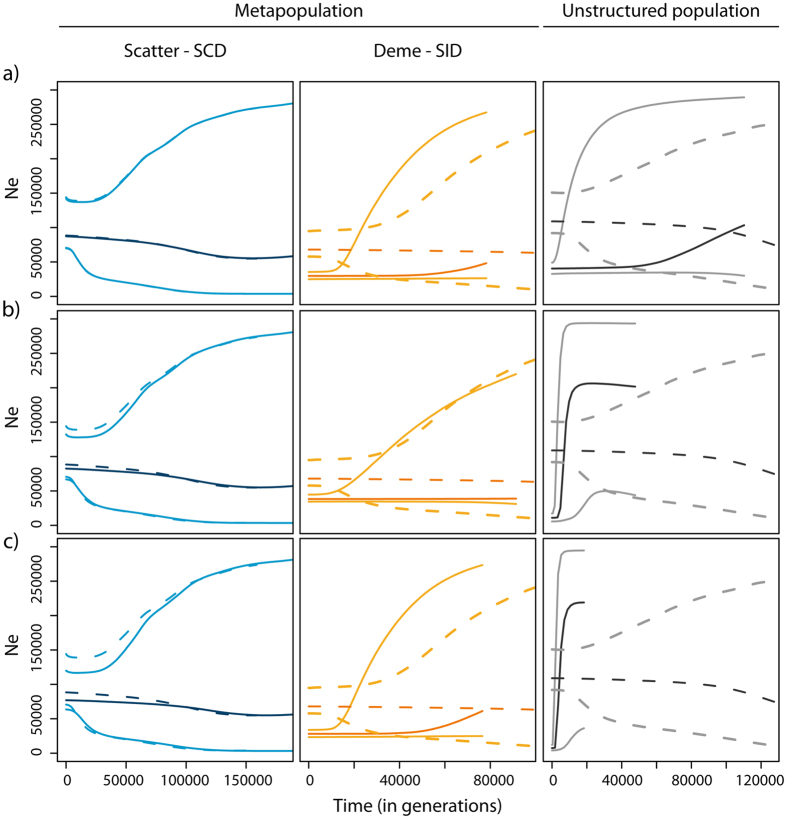
Figure 4. Average skyline reconstruction under model CHG2 of pseudo-observed data sets (pods) simulated with model FIM and FIM-BOTT in a metapopulation (for SCD and SID) and in an unstructured population (model CHG1 and CHG1-BOTT).
Data were simulated with Ibott = 1000 at: (a) Tbott = 10 generations; (b) Tbott = 50 generations; (c) Tbott = 100 generations before present. An average skyline reconstruction is shown across 1000 simulations. Solid lines: scenario with bottleneck (model FIM-BOTT and CHG1-BOTT); dashed line: scenario without bottleneck (model FIM and CHG1). Median values are shown (darker lines) with the 95% high posterior density interval (lighter lines).

