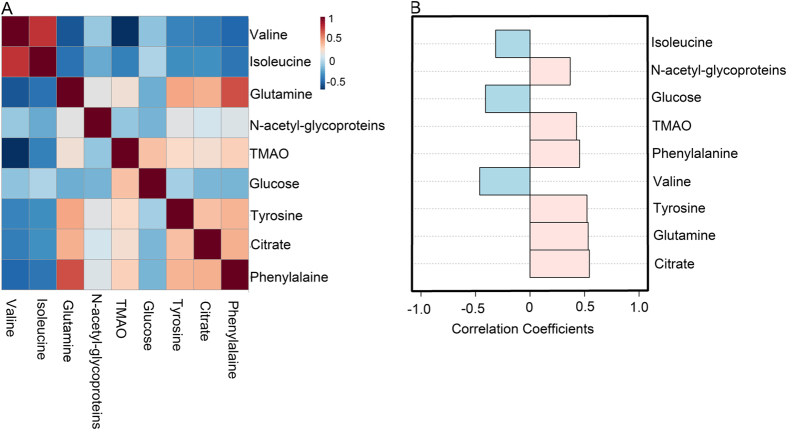
Figure 4. Systems analysis of potential biomarkers of psychological suboptimal and healthy controls with MetaboAnalyst 3.0 data annotation tools.
The correlation heatmap display the correlation coefficients (Spearman) among biomarkers. The color-coded scale of correlation is at left, where a red color indicates a positive correlation, while a blue color indicates a negative correlation (A). The correlation analysis with Pattern Hunter (Spearman) between group of psychological suboptimal health and healthy controls, a red color indicates a positive correlation with the state of psychological suboptimal health, a blue color indicates a negative correlation with the state of psychological suboptimal (B).

