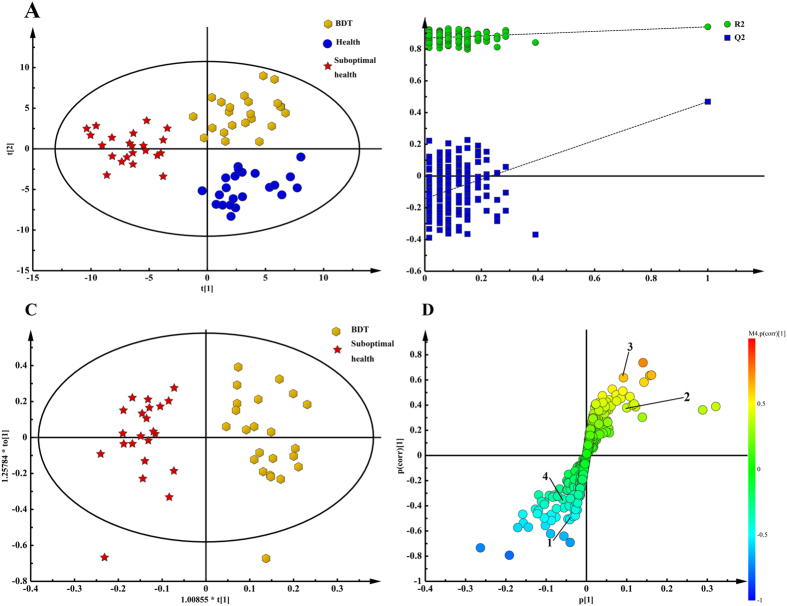
Figure 5. Pattern recognition with Simca-P13.0.
The PLS-DA scores plot derived from all the 1H-NMR plasma spectra including healthy controls, psychological suboptimal group and BDT group (A). The PLS-DA validation plots (permutation number: 200) for all samples including healthy controls, psychological suboptimal group and BDT group (B). The OPLS-DA scores plot between psychological suboptimal group and BDT group (C). Corresponding S-plot between psychological suboptimal group and BDT group and the metabolites changed significantly: 1, Phenylalanine; 2, Trimethylamine oxide; 3, Valine; 4, Glutamine (D).

