
Figure 6. The ROC curves of different biomarker combinations for diagnosis between group of psychological suboptimal and healthy controls.
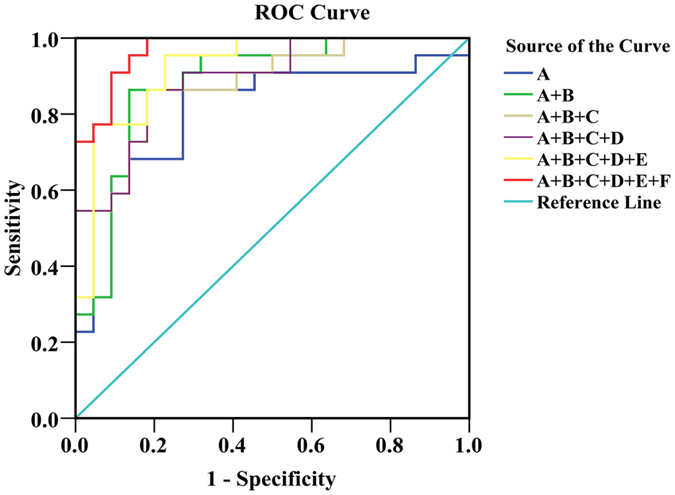
A, Citrate; B, Glutamine; C, Tyrosine; D, Phenylalanine; E, TMAO; F, N-acetyl-glycoproteins.
Official websites use .gov
A
.gov website belongs to an official
government organization in the United States.
Secure .gov websites use HTTPS
A lock (
) or https:// means you've safely
connected to the .gov website. Share sensitive
information only on official, secure websites.
A, Citrate; B, Glutamine; C, Tyrosine; D, Phenylalanine; E, TMAO; F, N-acetyl-glycoproteins.