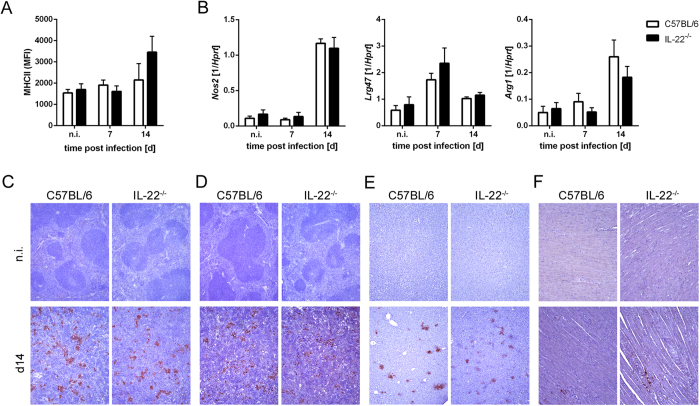
Figure 3. Unaltered macrophage activation in T. cruzi-infected IL-22−/− mice.
C57BL/6 mice and IL-22−/− mice were infected i.p. with 500 T. cruzi trypomastigotes. (A) The mean fluorescent intensity (MFI) of MHCII (I-A/I-E) expression on splenic macrophages (CD90.2−, CD11b+, CD11c+, Gr1−, MHCII+) was detected by flow cytometry. (B) mRNA expression of Nos2, Lrg47 and Arg1 in spleens was analyzed by real-time PCR at the indicated time points post infection. Similar results were obtained in two independent experiments. Results are expressed as means ± standard deviations of 5 mice per group (2–5 uninfected mice per group). (C) Organ sections of spleen (C,D), liver (E) and heart (F) were stained for NOS2 (C,E,F) and for ARG1 (D) and counterstained with hematoxylin. Representative sections from five mice per group (2 uninfected mice per group) are shown. Magnification: spleen, liver 100x; heart 200x.

