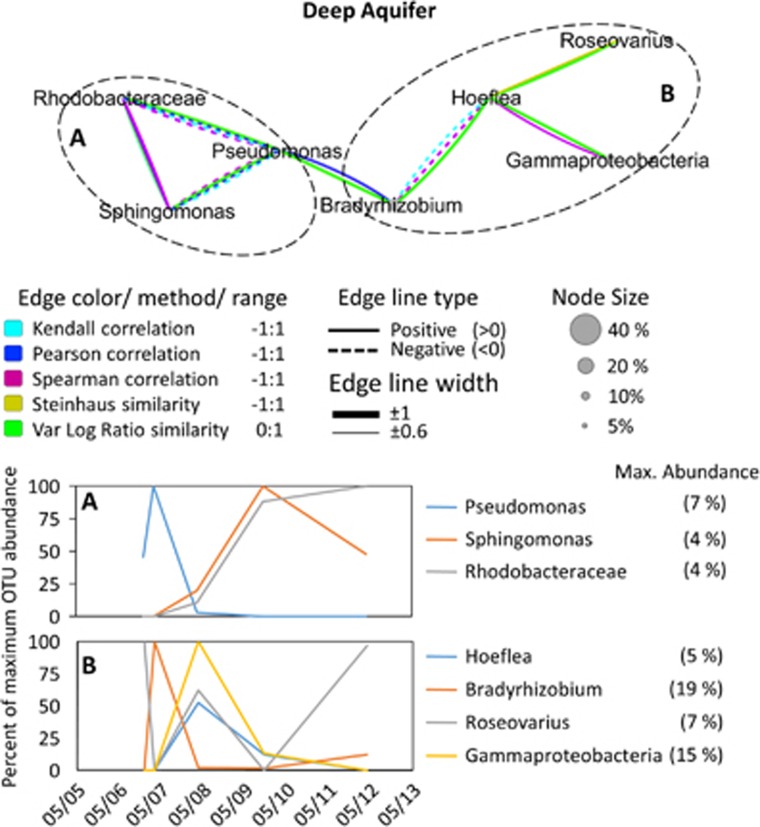
Figure 7.
Interspecies association network of the deep aquifer bacterial community, supported by two or more statistical methods (see legend) with a result of <−0.6 (negative association) or <0.6 (positive association). The temporal change in abundance of associated OTUs is given in the lower graphs. For illustration purposes, each OTU shown in the temporal graphs was normalized to its own maximum abundance. This value is provided in the graph legend.

