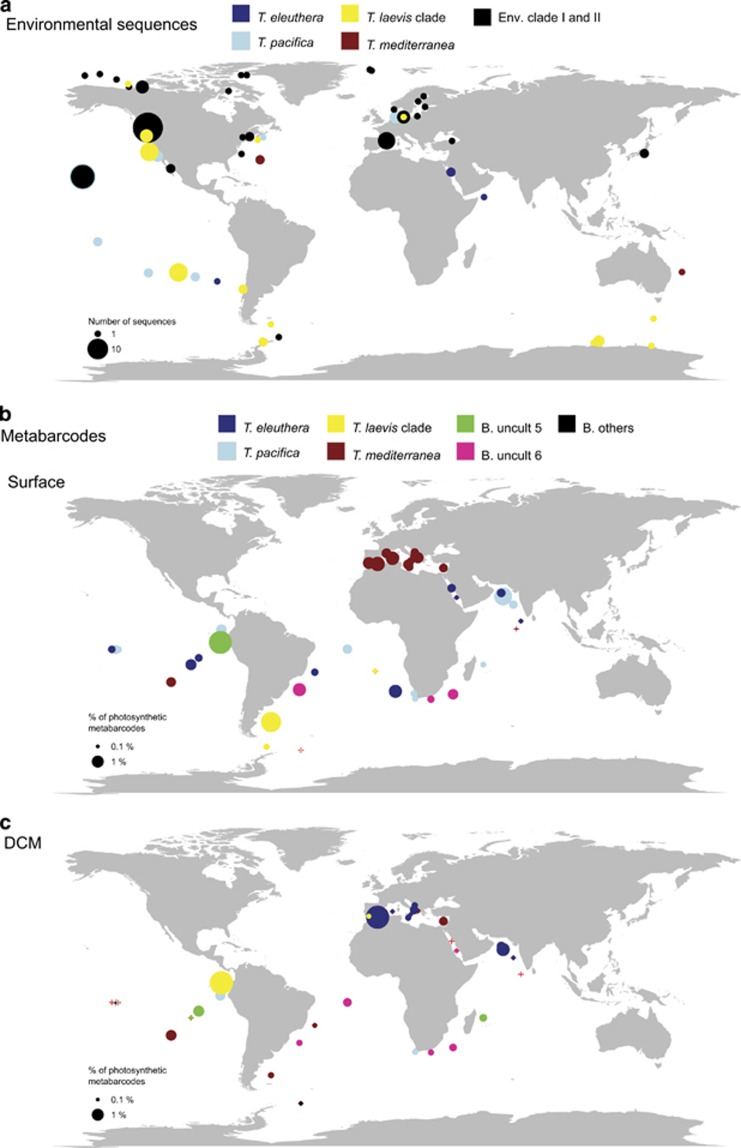
Figure 4.
Oceanic distribution of Bolidophyceae. (a) Based on available environmental sequences from GenBank and CAMERA databases (see Supplementary Table S2). (b) Based on Tara Oceans V9 metabarcodes from the 0.8 to 5 μm plankton size fraction from surface waters. (c) Idem but at the DCM. Color indicates for subpanel a, the taxonomic affiliation of the sequences (Supplementary Table S2) and for subpanels b and c, the dominant OTU at each station (OTUs 7–36 have been regrouped in the category ‘B. others'). Surface of the circle is proportional to the number of sequences (a) or to the total contribution of Bolidophyceae OTUs to sequences from photosynthetic groups (b and c). Red crosses correspond to the location of the Tara Oceans stations where no Bolidophyceae metabarcodes have been detected.

