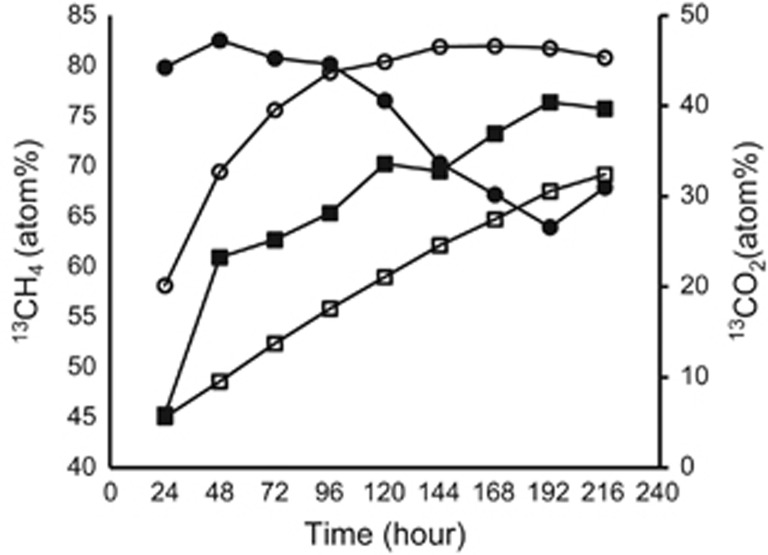
Figure 2.
Temporal change of the atom percent of 13CO2 and 13CH4 in the reactors fed with low concentrations of [U-13C]-acetate (▪ 13CH4; □ 13CO2); and in the reactors fed with high concentrations of [U-13C]acetate (• 13CH4; ○ 13CO2). The lines represent mean values (n=3), and error bars denote the standard deviation.

