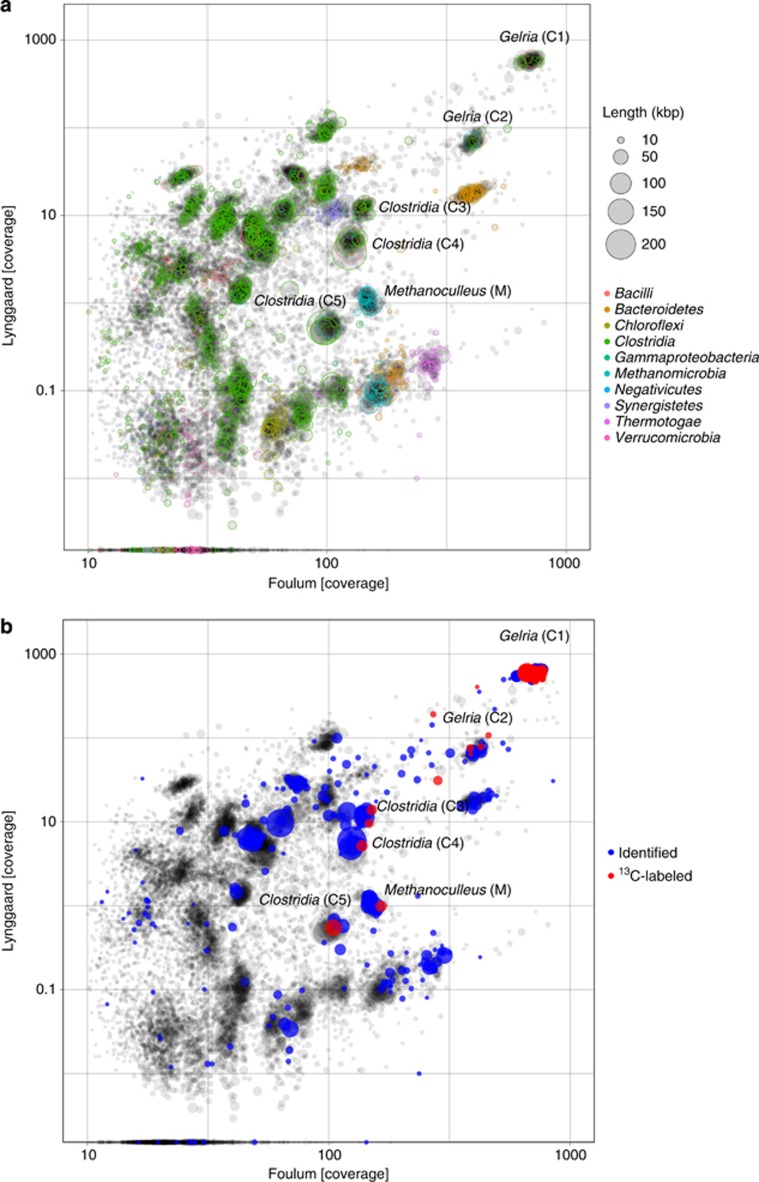
Figure 4.
The scaffold coverage from two metagenomes are plotted. The dot sizes indicate the scaffold length. (a) Coloring is according to phylogeny. (b) Coloring is observed in the protein-SIP analysis according to identified and 13C-labeled peptides. Labeling was seen in six clusters of scaffolds belonging to five subspecies of Clostridia and Methanoculleus.

