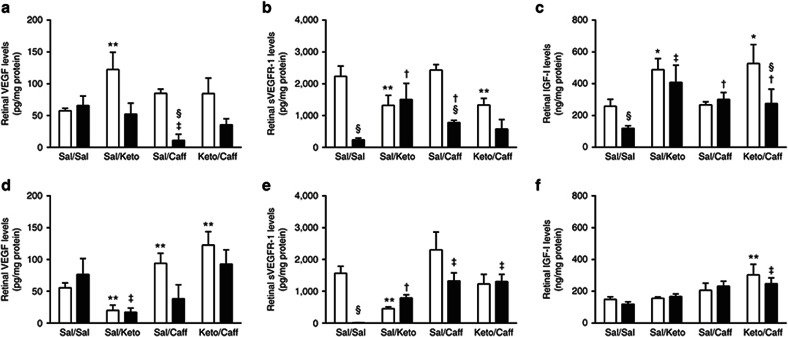
Figure 1.
Effects of Keto and/or Caff on retinal VEGF, sVEGFR-1, and IGF-I. The upper panel (a–c) are data at P14 (IH), and the lower panel (d–f) are data at P21 (IHR). The white bars represent the room air (RA) controls and the black bars represent the intermittent hypoxia (IH) at P14 or recovery from IH (IHR) at P21. Data are presented as mean ± SEM (n = 6 samples/group). *P < 0.01; **P < 0.01 vs. Sal/Sal RA; †P < 0.05; ‡P < 0.01 vs. Sal/Sal IH; §P < 0.01 vs. RA.

