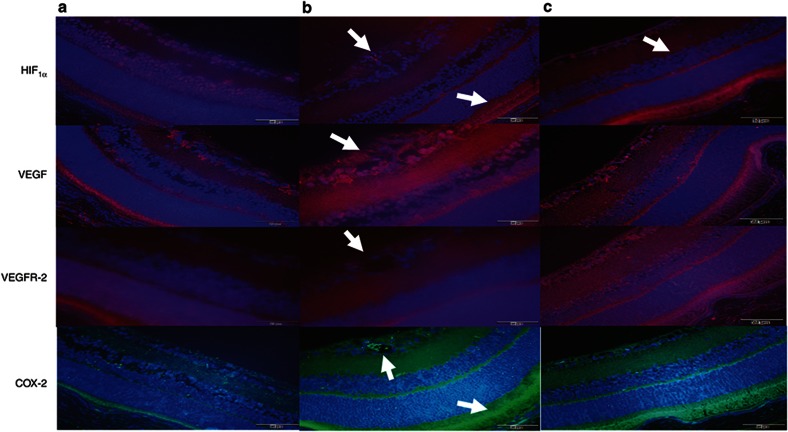
Figure 6.
Immunofluorescence of HIF1α, VEGF, VEGFR-2, and COX-2 in retinal layers from P21 RA controls, Sal/Sal IHR, and Keto/Caff IHR groups. Panel a represents RA controls, panel b represents Sal/Sal IHR groups, and panel c represents Caff/Keto IHR groups. Layers are described in Figure 5a. Compared to RA controls, Sal/Sal IHR retinas abundant VEGF and COX-2 immunostaining in the retinal cells invading the vitreous fluid (arrow), and increased HIF1α and COX-2 immunostaining in the P and C (arrow). Keto/Caff treatment decreased VEGF and COX-2, but not HIF1α in the P and C (arrow). Images are 40× magnification, bar scale is 20 µm.

