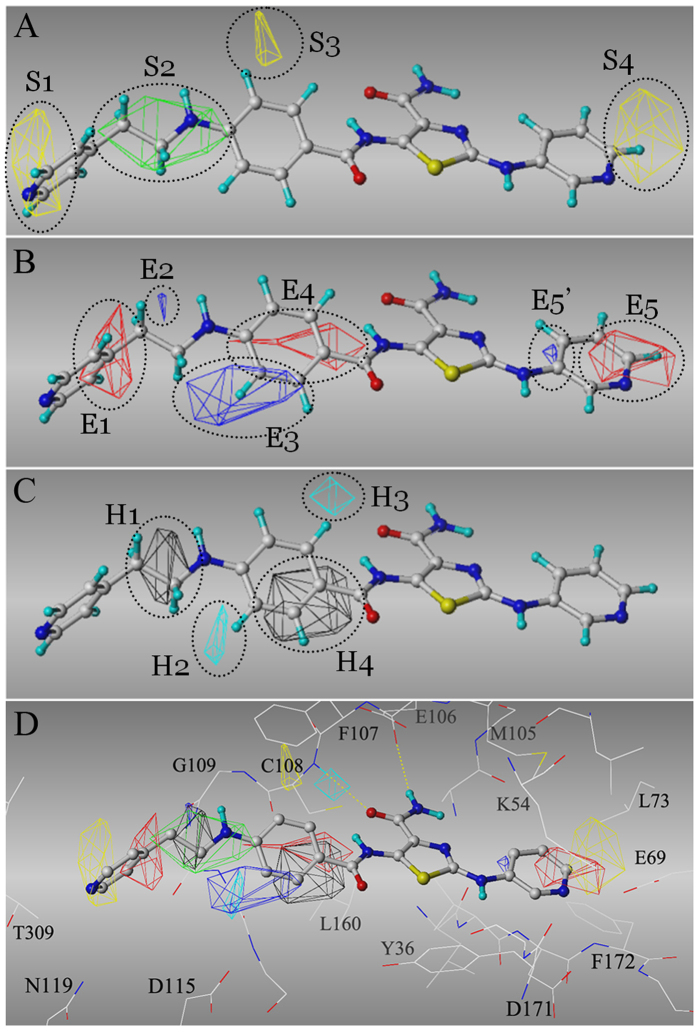
Figure 2. CoMSIA model derived from dataset I.
The most active inhibitor, A84 (in sticks), is used as an example to illustrate the CoMSIA fields (in grids). CoMSIA fields (A) Yellow – sterically unfavorable region; Green – sterically favorable region; (B) Blue – electronegative unfavorable (or electropositive favorable) region; Red – electronegative favorable (or electropositive unfavorable) region; (C) Cyan – hydrophobicity unfavorable region; Black – hydrophobicity favorable region. (D) Overlapping the CoMSIA fields to TNIK kinase domain (in lines). Yellow dashed lines indicated the hydrogen bonds with the hinge.

