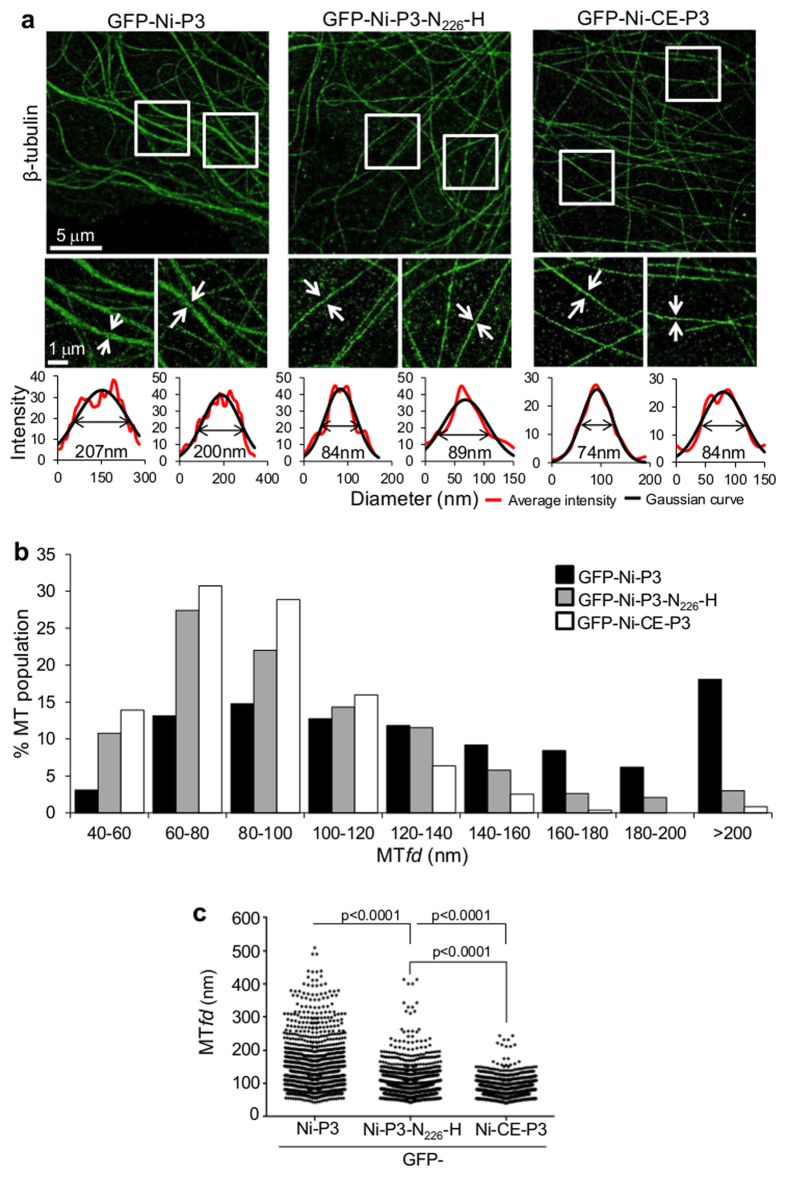
Figure 4. Quantitative dSTORM analysis of P3-induced bundling of MTs.
(a) dSTORM images of immunostained β-tubulin in COS-7 cells expressing the indicated proteins are shown in the upper panels. Boxed areas are expanded in the lower panels, and Gaussian functions (black line) fit to the average intensity profile (red line) of the indicated filaments shown below. The derived MTfd (calculated at the full width half-height of the Gaussian function) is indicated. (b) The frequency distribution of MTfds calculated for each protein is shown (n = 1294 [GFP-Ni-P3], 1071 [GFP-Ni-CE-P3] and 1299 [GFP-Ni-P3-N226-H]; measurements are from 10 cells for each protein over two identical assays). (c) Scatter dot plots of MTfds shown in (b). p values were determined using the Mann-Whitney test.

