
FIGURE 2.
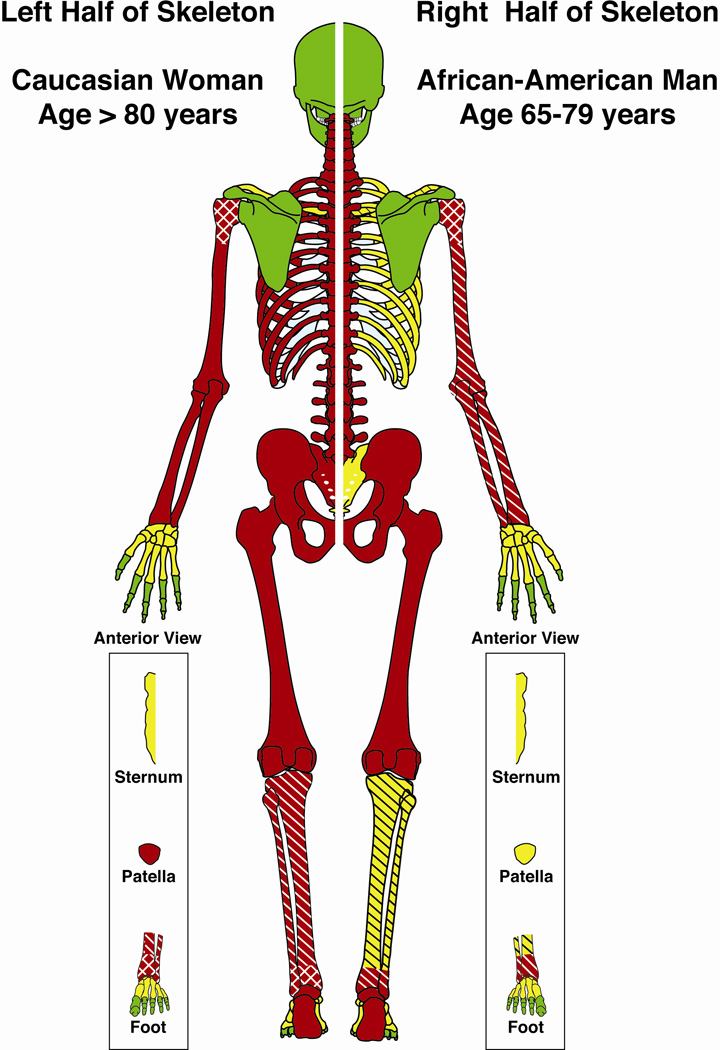
Skeletal depiction of Expert Panel (EP) osteoporosis fracture attribution scores. The two halves of the skeleton depict persons with differing clinical risk factors. Colors indicate three levels of fracture attribution by the EP across the 9- point Likert scale. Red: most likely due to osteoporosis (median Likert scores 7–9), Green: least likely due to osteoporosis (scores 1–3), Yellow: indeterminate likelihood of being due to osteoporosis (scores 4–6). Unless specified, scores were of the same level for closed, open and pathological fractures at that site. A single hatch pattern  indicates that an open fracture score was one level less likely to be osteoporotic than a closed fracture at the same site and a double hatch pattern
  indicates a decline of two levels.