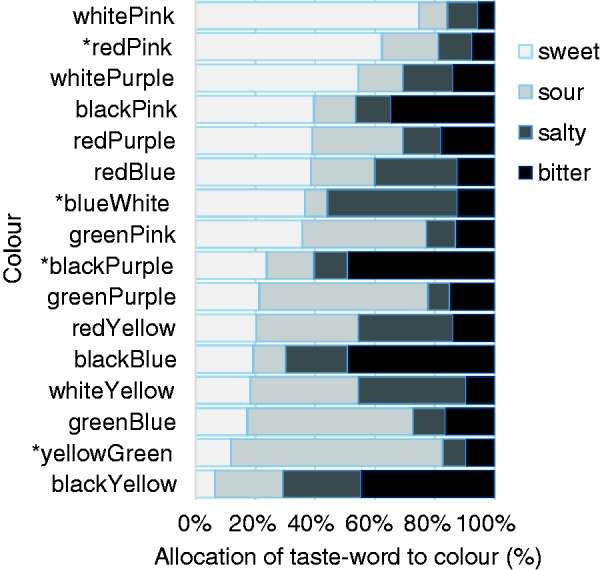
Figure 5.

Proportion of trials in which each taste word was associated with each of the 16 color pairs (congruent pairs are prefixed with an *). As can be seen from visual inspection of this figure, the sweet-pink, the yellow- and green-sour, white-salty, and black-bitter correspondences stand out. Intriguingly, though, when white (individually salty) and pink (individually sweet) were paired, it was the sweet association that dominated participants’ responses. The highest percentage of sour associations was with the yellow-green color pair, as might have been expected given the results reported earlier (see Figure 3).
