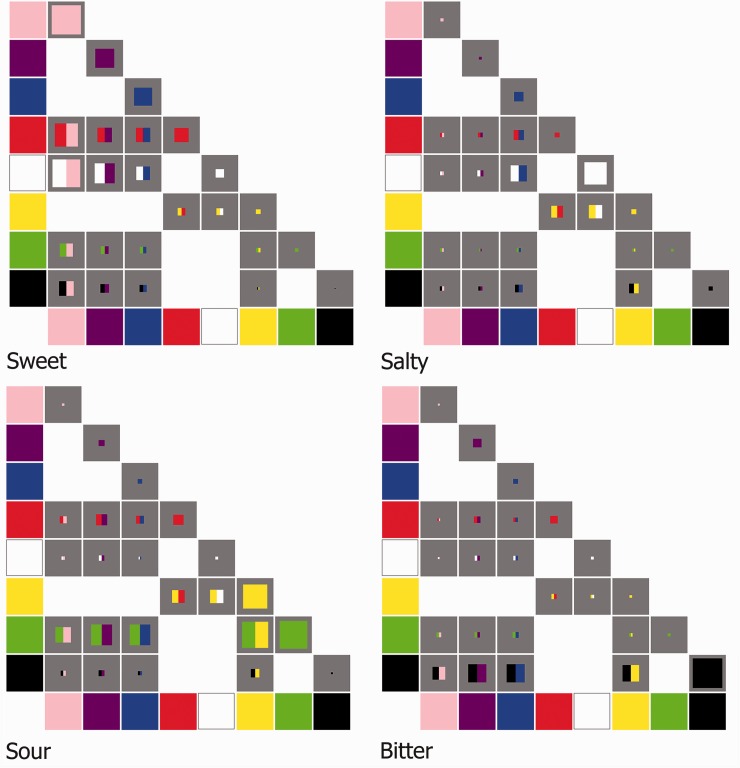
Figure 6.
Four color matrix plots depicting the frequency with which the different colors and color-pairs were selected for each of the four basic taste terms used in the present study. For each plot, the eight colors are shown along the x- and y-axes. At the intersection of the color on each axis, the presence of a gray box indicates that a specific combination of colors was tested for in the experiment (no gray box indicating that this color-pair was not tested). The square color patch within each gray box consists of the color, or colors, that was or were presented to participants in order to assign a basic taste to. The size of the color patch, relative to the size of the gray box, represents the number of participants who chose that color patch to reflect the given basic taste (the length of the patch as compared with the length of the gray box representing the ratio of participants choosing that particular taste for the given color). So, if the patch were to fill the entire gray box, this would imply that every participant selected the given color for the particular matrix’s taste; if the gray box were, however, to be empty, this would imply that none of the participants selected that color.

